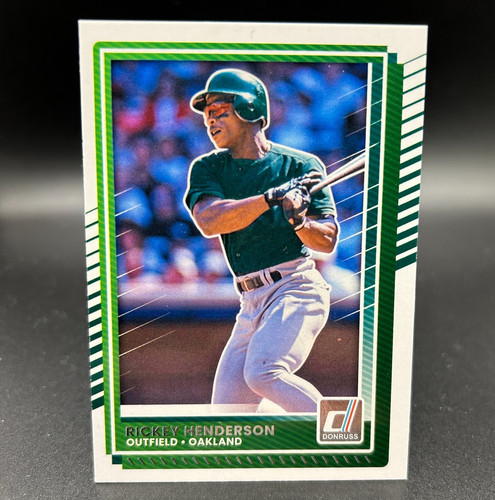
Subject of Chapter 77 of the book The Baseball 100 by Joe Posnarski [1989] World Series Champion with Oakland Athletics [1993] World Series Champion with Toronto Blue Jays [2009] Inducted into the National Baseball Hall of Fame (Baseball Writers) ... His #24 was retired by the Athletics on August 1,2009 [2018] Inducted into the Athletics Hall of Fame
Unlock the power of TBC PREMIUM for only $2/month.
year
teams
g
gs
cg
gf
ph
pr
dr
gs%
cg%
exit ph
exit pr
exit dr
ln1
ln2
ln3
ln4
ln5
ln6
ln7
ln8
ln9
pos-p
pos-c
pos-1b
pos-2b
pos-3b
pos-ss
pos-lf
pos-cf
pos-rf
pos-dh
1979
OAK
89
89
86
86
0
0
0
100.0
96.6
1
0
2
89
0
0
0
0
0
0
0
0
0
0
0
0
0
0
62
32
1
0
1980
OAK
158
158
151
151
0
0
0
100.0
95.6
1
0
6
158
0
0
0
0
0
0
0
0
0
0
0
0
0
0
157
0
0
1
1981
OAK
108
107
103
103
1
0
0
99.1
96.3
0
0
5
107
0
0
0
0
0
1
0
0
0
0
0
0
0
0
107
0
0
0
1982
OAK
149
145
138
139
0
4
0
97.3
95.2
2
1
7
144
0
1
0
0
0
0
1
0
0
0
0
0
0
0
140
11
0
1
1983
OAK
145
137
123
129
7
0
1
94.5
89.8
2
1
13
137
0
0
2
0
3
1
0
1
0
0
0
0
0
0
138
9
0
1
1984
OAK
142
132
115
118
3
3
4
93.0
87.1
8
0
16
133
0
0
0
0
1
0
1
1
0
0
0
0
0
0
140
6
0
0
1985
NYA
143
141
129
130
1
1
0
98.6
91.5
5
0
8
141
0
0
0
1
0
0
0
0
0
0
0
0
0
0
6
141
0
1
1986
NYA
153
149
141
145
3
0
1
97.4
94.6
1
0
7
148
0
1
0
1
0
0
2
1
0
0
0
0
0
0
11
138
0
5
1987
NYA
95
93
87
88
2
0
0
97.9
93.5
2
1
4
90
0
1
1
2
0
0
1
0
0
0
0
0
0
0
34
39
0
24
1988
NYA
140
138
128
129
1
1
0
98.6
92.8
1
1
9
138
1
0
0
0
0
0
0
0
0
0
0
0
0
0
135
3
0
3
1989
NYA,OAK
150
148
136
138
2
0
0
98.7
91.9
7
0
5
149
0
0
0
0
0
0
0
1
0
0
0
0
0
0
147
0
0
3
1990
OAK
136
132
109
112
2
1
1
97.1
82.6
9
0
15
132
0
1
0
1
0
0
0
1
0
0
0
0
0
0
119
0
0
14
1991
OAK
134
126
105
112
5
1
0
94.0
83.3
6
0
16
126
1
0
2
0
0
1
0
3
0
0
0
0
0
0
119
0
0
8
1992
OAK
117
110
94
97
2
2
1
94.0
85.5
4
2
14
110
0
0
1
0
1
0
0
1
0
0
0
0
0
0
108
0
0
5
1993
OAK,TOR
134
131
116
119
0
0
0
97.8
88.5
9
0
6
127
0
4
1
1
0
1
0
0
0
0
0
0
0
0
118
0
0
13
1994
OAK
87
83
70
73
4
0
0
95.4
84.3
9
0
5
81
1
3
0
0
0
0
1
1
0
0
0
0
0
0
66
10
0
13
1995
OAK
112
107
89
94
4
0
0
95.5
83.2
8
1
9
107
0
0
1
1
0
1
1
1
0
0
0
0
0
0
90
0
0
18
1996
SDN
148
122
114
130
13
6
7
82.4
93.4
8
0
10
122
2
1
0
1
2
1
0
15
0
0
0
0
0
0
114
10
17
0
1997
ANA,SDN
120
107
97
107
10
0
3
89.2
90.7
8
1
4
105
0
0
0
2
0
1
1
11
0
0
0
0
0
0
66
19
8
21
1998
OAK
151
143
130
135
4
3
1
94.7
90.9
4
0
12
144
0
0
0
0
1
0
3
0
0
0
0
0
0
0
141
24
0
0
1999
NYN
121
114
87
93
5
0
2
94.2
76.3
14
1
13
114
0
0
0
0
1
0
1
5
0
0
0
0
0
0
116
0
0
1
2000
SEA,NYN
123
116
82
83
0
6
1
94.3
70.7
16
0
24
117
0
0
0
0
0
0
0
0
0
0
0
0
0
0
118
0
0
0
2001
SDN
123
98
83
97
14
8
3
79.7
84.7
8
1
17
98
0
0
2
2
0
0
0
14
0
0
0
0
0
0
104
0
0
0
2002
BOS
72
46
36
46
7
17
1
63.9
78.3
10
1
15
48
0
0
1
3
2
1
2
0
0
0
0
0
0
0
49
4
1
1
2003
LAN
30
17
13
19
13
0
0
56.7
76.5
7
0
4
15
3
0
0
0
0
1
0
11
0
0
0
0
0
0
18
0
0
0
year
teams
g
gs
cg
gf
ph
pr
dr
gs%
cg%
exit ph
exit pr
exit dr
ln1
ln2
ln3
ln4
ln5
ln6
ln7
ln8
ln9
pos-p
pos-c
pos-1b
pos-2b
pos-3b
pos-ss
pos-lf
pos-cf
pos-rf
pos-dh
Tot:
3080
2889
2562
2673
103
53
26
93.8
88.7
150
11
246
2880
8
12
11
15
11
9
14
67
0
0
0
0
0
0
2423
446
27
133
G: Games ... GS: Games Started ... CG: Completed Games ... GF: Games Finished ... PH: Pinch Hitter ... PR: Pinch Runner ... DR: Defensive Replacement ... GS%: Games Started % ... CG: Complete Games% ... EXIT PH: Exited for Pinch Hitter ... exit PR: Exited for Pinch Runner ... exit DR: Exited for defensive replacement ... ln1-9: Lineup Slots 1-9 ... Games at position
G: Games ... PA: Plate Appearances ... AB: At Bats ... ONBS: On base (H+BB+HBP) ... ONBS2: All On Base (H+BB+HBP+ERROR+FC+FO) ... OBP: On Base Percentage ... OBP2: On Base Percentage for ONBS2 ... H: Hits ... BB: Walks ... HBP: Hit by Pitch ... ROE: Reached on Error ... FC: Fielder`s Choice ... FO: Forceouts ... CI: Catcher`s Interference ... SGL: Singles ... DBL: Doubles ... TPL: Triples ... HR: Home Runs ... IFH: Infield Hits ... BNT: Bunts ... B-H: Bunt hits ... PH-H: Pinch Hits ... PH-HR: Pinch hit home runs ... HR1: Solo home runs ... HR2: 2-run Homers ... HR3: 3-run Homers ... HR4: Grand Slams ... IPHR: Inside the park homers ... RBI: Runs batted in ... HR-RBI: RBIS on Home Runs ... HR-RBI%: % of RBIs on Home Runs ... RBI2: Runs batted in on outs ... BB4: Walks on 4 pitches ... BB1OP: Walks with 1st base open ... RON: PA with runners on ... BR: # of Baserunners ... RBI%: % of opportunities with RBI ... OPP: RBI Opportunities Points ... CONV: RBIs points converted ... CONV%: Converted% ... LDOF: Leadoff ... OB: Leadoff onbase ... LD-OB%: Leadoff onbase% ... LAST: Last batter of game ... WOH: Walk-off Hits ... WOHR: Walk-off Home Runs
Unlock the power of TBC PREMIUM for only $2/month.
year
teams
g
pa
sb
sb2
sb3
sbh
di
sb%
cs
cs2
cs3
csh
s12
s13
s23
s2h
d13
d1h
advx
adv_opp
adv_pct
pthr
pckff
wppb
adv_out
oob
r
onbs
run%
1979
OAK
89
398
33
27
6
0
0
75.0
11
10
1
0
8
5
7
8
1
2
15
31
48.4
0
1
3
37
6
49
151
32.45
1980
OAK
158
722
100
82
16
2
0
79.4
26
19
5
2
26
15
9
27
0
3
45
80
56.3
0
12
6
79
9
111
336
33.04
1981
OAK
108
493
56
48
8
0
0
71.8
22
15
6
1
10
12
4
19
3
1
32
49
65.3
0
9
9
53
3
89
219
40.64
1982
OAK
149
656
130
94
34
2
0
75.6
42
26
13
3
13
10
5
22
2
4
36
56
64.3
0
6
8
68
3
119
300
39.67
1983
OAK
145
622
108
79
29
0
0
85.0
19
15
4
0
14
16
4
16
4
3
35
57
61.4
0
5
6
57
7
105
286
36.71
1984
OAK
142
597
66
50
16
0
0
78.6
18
15
3
0
14
13
5
18
6
9
40
65
61.5
0
2
7
57
0
113
259
43.63
1985
NYA
143
654
80
65
15
0
0
88.9
10
7
3
0
10
21
5
21
6
6
48
69
69.6
0
8
16
70
5
146
303
48.18
1986
NYA
153
701
87
72
15
0
0
82.9
18
14
4
0
12
11
5
16
5
7
34
56
60.7
0
10
8
63
5
130
282
46.10
1987
NYA
95
440
41
32
9
0
0
83.7
8
8
0
0
14
11
3
11
3
5
27
47
57.4
0
4
8
28
1
78
202
38.61
1988
NYA
140
647
93
62
31
0
0
87.7
13
11
2
0
12
13
10
17
2
5
35
59
59.3
147
8
12
60
5
118
279
42.29
1989
NYA,OAK
150
674
77
53
24
0
3
84.6
14
8
5
1
26
17
9
26
1
1
44
80
55.0
77
13
13
63
2
113
296
38.18
1990
OAK
136
594
65
48
17
0
1
86.7
10
8
2
0
22
12
9
27
9
4
43
83
51.8
128
7
7
46
4
119
279
42.65
1991
OAK
134
578
58
37
21
0
0
76.3
18
12
5
1
22
18
4
13
3
5
36
65
55.4
111
4
7
48
4
105
254
41.34
1992
OAK
117
499
48
39
9
0
1
81.4
11
9
2
0
12
12
8
11
1
4
27
48
56.3
110
2
5
50
4
77
226
34.07
1993
OAK,TOR
134
610
53
38
15
0
1
86.9
8
7
1
0
27
17
5
15
5
2
34
71
47.9
109
3
10
62
3
114
286
39.86
1994
OAK
87
376
22
16
6
0
3
75.9
7
7
0
0
19
7
1
14
5
3
24
49
49.0
73
2
3
43
3
66
162
40.74
1995
OAK
112
487
32
21
11
0
1
76.2
10
8
2
0
16
12
4
11
3
2
25
48
52.1
63
3
8
44
4
67
212
31.60
1996
SDN
148
602
37
31
6
0
0
71.2
15
11
4
0
21
20
7
14
10
5
39
77
50.6
103
3
9
56
5
110
269
40.89
1997
ANA,SDN
120
509
45
37
8
0
1
84.9
8
7
1
0
23
10
5
19
4
10
39
71
54.9
90
4
7
44
3
84
216
38.89
1998
OAK
151
670
66
51
15
0
0
83.5
13
9
4
0
27
15
5
16
8
5
36
76
47.4
82
5
10
60
7
101
273
37.00
1999
NYN
121
526
37
34
3
0
1
72.5
14
12
2
0
16
14
7
20
3
6
40
66
60.6
84
5
6
42
2
89
232
38.36
2000
SEA,NYN
123
519
36
31
5
0
1
76.6
11
11
0
0
14
13
6
4
4
6
23
47
48.9
5
4
4
48
4
75
206
36.41
2001
SDN
123
465
25
22
3
0
3
78.1
7
7
0
0
18
7
4
9
5
10
26
53
49.1
4
1
5
21
1
70
180
38.89
2002
BOS
72
222
8
8
0
0
0
80.0
2
2
0
0
9
6
3
8
3
1
15
30
50.0
3
2
5
22
0
40
87
45.98
2003
LAN
30
84
3
3
0
0
1
100.0
0
0
0
0
3
2
0
1
0
0
3
6
50.0
9
1
0
5
0
7
28
25.00
year
teams
g
pa
sb
sb2
sb3
sbh
di
sb%
cs
cs2
cs3
csh
s12
s13
s23
s2h
d13
d1h
advx
adv_opp
adv_pct
pthr
pckff
wppb
adv_out
oob
r
onbs
run%
Tot:
3080
13345
1406
1080
322
4
17
80.8
335
258
69
8
408
309
134
383
96
109
801
1439
55.7
1198
124
182
1226
90
2295
5823
39.41
G: Games ... PA: Plate Appearances ... AB: At Bats ... SB: Stolen Bases ... SB2: Steals of 2b ... SB3: Steals of 3b ... SBH: Steals of home ... DI: Advanced on defensive indifference ... SB%: Stolen base % ... CS: Caught stealing ... CS2: Caught stealing 2b ... CS3: Caught stealing 3b ... CSH: Caught stealing home ... S12: Advanced from 1st to 2nd on singled... S13: Advanced from 1st to 3rd on single ... S23: Advanced from 2nd to 3rd on single ... S2H: Scored from 2nd on single ... D13: Advanced from 1nd to 3rd on double ... D1H: Scored from 1st on double ... ADVX: Advanced an extra base on hit ... ADV-OPP Advancement opportunities on hits ... ADV_PCT: Advanced extra base % ... PTHR: Pickoff throws ... PCKFF%: Picked off ... WPPB: Advanced on wild pitch or passed ball ... ADV_OUT: Advanced on out ... OOB: Out on bases ... R: Runs scored ... ONBS: On base ... RUN%: % of times on base run scored